Screener Overview A
Video Guide
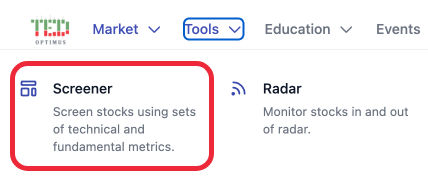
Navigation Instruction
Tools → Screener
Description
-
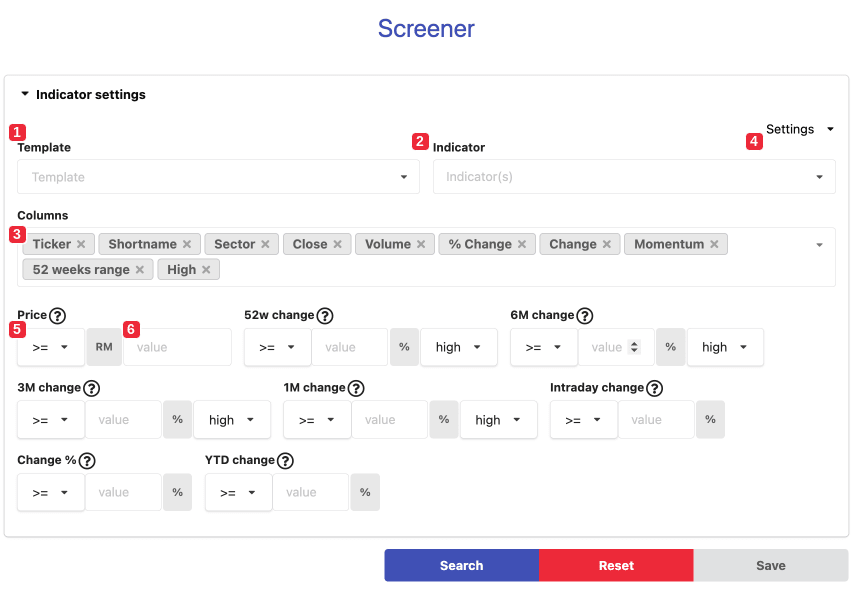
Screener separates stocks depending on the user-defined metrics
-
Our screener includes basic info, fundamental metrics (soon)
-
Technical indicators and corporate announcement (soon)
-
We have a unique feature called ‘Backtesting’
-
Backtesting allows users to screen stock as if they were screened on a historical date
Overview - Part A