Breadth SMA / EMA
Navigation Instruction
Market → SMA/EMA

Description
-
SMA/EMA is a breadth indicator on relevant industries based on Simple Moving Average and Exponential Moving Average
-
Green Bull is issued when most stocks have a price higher than SMA or EMA
Overview

| No. | Content | Description |
|---|---|---|
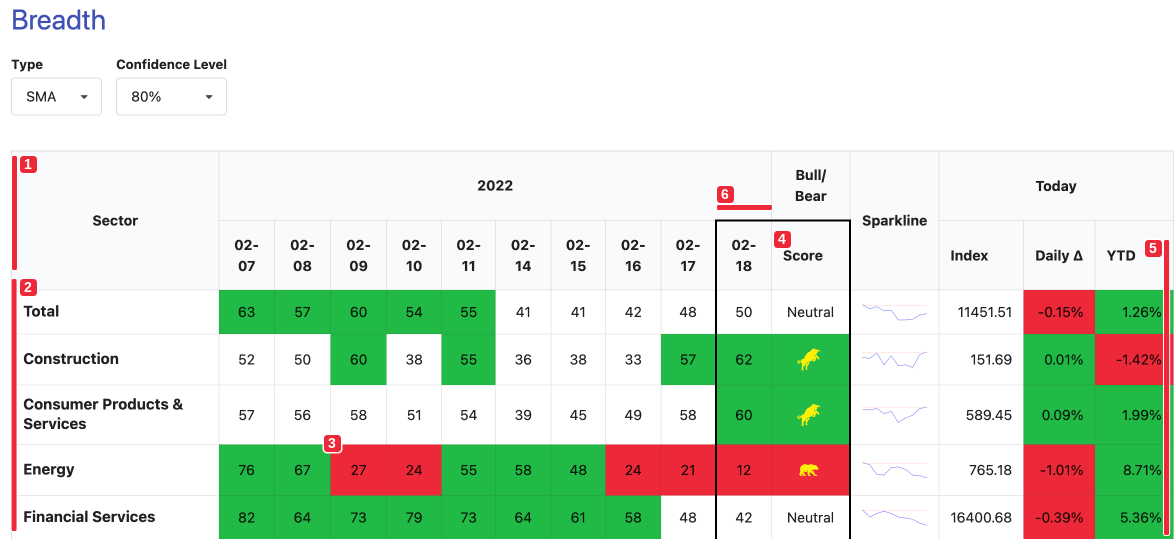
| 1 | SMA/EMA | SMA/ EMA breadth indicator has two selection criteria, which are 1, Type and 2, Confidence Level |
| 2 | Type | You can choose SMA (refers to SMA 5), or EMA (refers to EMA 4) |
| 3 | Confidence level | The second selection, confidence level, allows you to choose the accuracy of the signal. A higher confidence level will yield fewer results, but a higher probability of predicting the sector index movement |
Interpretation
| No. | Content | Description |
|---|---|---|
| 1 | Column header | list of historical trading date |
| 2 | Total and other sectors (1st column) | total represents all stocks in Bursa Malaysia while other sectors represent stocks in respective sectors |
| 3 | Number | the number that appeared under each date means, percentage of stocks with the closing price higher than SMA5 or EMA4. e.g., 42 means 42% of all stocks have closing prices higher than SMA5 |
| 4 | Score | to identify whether a particular Sector is bullish based on the percentage of stocks with the closing price higher than SMA5 or EMA4, according to the latest results |
| 5 | Green Bull / Neutral | the sector is very bullish ; Red Bear - the sector is very bearish or the sector is neutral (indifferent between Bullish and Bearish)' |
| 6 | Date (02-18) | the last trading date associated with the Bull/Bear |