Breadth (Tick)
Navigation Instruction
Market → Tick

Description
-
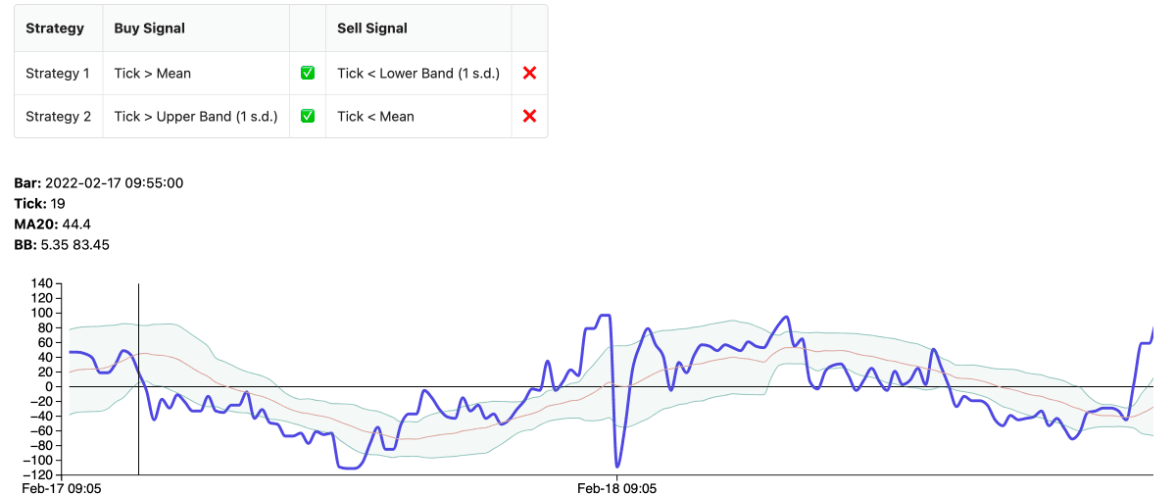
TICK index is an intraday breadth indicator on the entire market based on the number of uptick stocks minus the number of downtick stocks
-
The market is bullish when the TICK index is trending upwards
Interpretation
-
TICK Index shows the strength of the market at a 5-minute time interval
-
When the TICK figure is positive (TICK > 0) , it means most stocks are in upwards movement
| No. | Content | Description |
|---|---|---|
| 1 | Upstick | the stock exhibits a higher price compared to 5 minutes ago |
| 2 | Downstick | the stock exhibits a lower price compared to 5 minutes ago |
| 3 | TICK | the total stocks in Uptick minus total stocks in Downtick. TICK is available in all major index components in the USA including NYSE, NASDAQ. TICK is used to identify reversals in intraday trend based on readings of extremes i.e, +/- 1000 |
| 4 | Bollinger Band | At TTW, we use Bollinger Band with 1 standard deviation as upper/ lower band. When TICK crosses above its Middle Band or Upper Band (trending upwards), the market is identified as bullish |